BuyingMortgage Rates July 8, 2025

What You Should Know About Getting a Mortgage Today 2025

BuyingMarkets July 8, 2025

Think No One’s Buying Homes Right Now? Think Again. 2025 July

My Monthly Market Summary July 8, 2025

July Phoenix Housing Market Update 2025

Here are the basics – the ARMLS numbers for July 1, 2025 compared with July 1, 2024 for all areas & types:
  • Active Listings: 25,683 versus 18,121 last year – up 42% – but down 3.4% from 26,580 last month
  • Under Contract Listings: 7,702 versus 7,402 last year – up 4.1% – but down 2.9% from 7,936 last month
  • Monthly Sales: 6,629 versus 6,319 last year – up 4.9% – but down 6.8% from 7,114 last month
  • Monthly Average Sales Price per Sq. Ft.: $293.08 versus $295.31 last year – down 0.8% – and down 2.4% from $300.16 last month
  • Monthly Median Sales Price: $450,000 the same as last year – but down 1.1% from $455,000 last month
Though the changes were small, there was good news for sellers on both supply and demand compared to last month. We saw a significant number of cancellations and expirations at the end of the second quarter, meaning we have less supply as we start the third quarter. We enjoyed one extra working day in June 2025 compared to June 2024, so sales going up 4.9% is about par for the course, rather than a win. However listings under contract are up compared to a year ago as buyers react to a slight reduction in mortgage rates. This is genuine good news. They may also be reacting to falling asking prices as buyers inject more realism into their listings. Closed prices are down sharply from May when measured by average $/SF and are now slightly lower than last year. The median sales price is the same as last year but down 1.1% from last month.
The good news on supply and demand is welcome and is enough to stop the Cromford® Market Index from dropping further. If current trends continue, then it could well start to rise again. However, the increased demand is fragile and might disappear if mortgage rates head back up towards 7% again. Also the reduction in supply is largely due to sellers giving up, which is not as positive a sign as increased closing rates. Many of these expired and cancelled listings are likely to come back again in the fourth quarter, although we know of several that have been converted to rental listings instead.
The high-end of the market remains strong, but it tends to be much less active during the summer, and the entry-level market is still trending weaker. For this reason, we would expect price measurements to be flat to lower during the next 3 months. This means homes are getting cheaper relative to everything else. At some point, especially if interest rates also make a move lower, then demand could see a nice recovery. Home ownership is still very desirable.   Source Cromford Report
As 2025 unfolds, it’s clear the Phoenix housing market isn’t crashing — it’s recalibrating. Prices are stabilizing, inventory is gradually improving, and well-prepared buyers are staying active.
Phoenix continues to attract with job growth, quality of life, and steady in-migration. Still, interest rates, affordability, policy uncertainty, and equity gaps remain hurdles.
The fundamentals are strong — it’s about patience and perseverance.”
Buyers are adjusting to higher interest rates with more confidence than expected.  If you can afford to buy, now is probably a good time.
Thinking of buying or selling?  Let’s talk.  With over 21 years of experience, I’ll help you navigate the market and make informed decisions.
Are you interested in what your home is worth?  Click the Home Valuation link below in my signature line.  How about an equity analysis report?  You may have more equity than you’re aware of.

MarketsMy Monthly Market Summary May 5, 2025

Phoenix Housing Market Report for May 1, 2025

Our markets have taken a downturn, and I expect downward pressure to persist at least through the 4th quarter. This, however, presents a great opportunity for homebuyers who have been waiting for more favorable terms and better pricing. As the economy slows, interest rates should ease, providing further benefits for homebuyers. Now is the time to act or prepare—waiting for the perfect moment to time the market could mean missing out. Once the market begins to turn around, the window of opportunity will close quickly.

To remain competitive, sellers must be prepared to offer concessions and stay flexible on price, especially if the property isn’t show-ready or in a prime location. The days of listing high and expecting multiple offers are behind us, at least for now.

“Since the housing market peaked in June of 2022, many of you may not be fully aware of where the key statistics stand today.”

These are the housing stats for May of 2022, which was the top in the market:

Monthly Average Sales Price per Sq. Ft. May 2022: $303.55
Monthly Median Sales Price- May 2022: $475,000

And these are housing stats for April of 2025: Today

Monthly Average Sales Price per Sq. Ft. May 2025: $299.30
Monthly Median Sales Price May 2025: $445,000

Price Per Sq Ft is down -1.4% in 3 years.
Median Sales Price is down -6.3% in 3 years.

Because the luxury market has remained strong, with significantly higher price points, price-per-square-foot figures can be misleading. The monthly median sales price offers a more accurate and balanced view of the overall housing market.

“Feel free to reach out anytime—it’s more important than ever to work with an experienced agent who can help you confidently navigate today’s challenging market.” Shawn

Here is the……
Market Summary for the Beginning of May

Here are the basics – the ARMLS numbers for May 1, 2025 compared with May 1, 2024 for all areas & types:

Active Listings: 26,190 versus 17,129 last year – up 53% – and up 4.8% from 24,990 last month.

Under Contract Listings: 9,047 versus 9,336 last year – down 3.1% – and down 0.7% from 9,113 last month.

Monthly Sales: 7,303 versus 7,045 last year – up 3.7% – and up 4.89% from 6,967 last month.

Monthly Average Sales Price per Sq. Ft.: $299.30 versus $306.53 last year – down 2.4% – and down 3.7% from $310.76 last month.

Monthly Median Sales Price: $445,000 versus $450,000 last year – down 1.1% – and down 3.2% from $459,500 last month.

There were 22 working days in both April 2025 and April 2024, so we do not need to make any calendar-based adjustments.

Transaction volumes improved, with closings up 3.7% compared with April 2024. However dollar volume declined, because closed pricing dropped hard between March and April. There are three factors behind this….

Higher volumes at the lower end of the market.
The top end of the market has slowed down.
A general downward trend in prices due to buyers taking increased control of the market.

Supply continued to climb throughout April but the growth rate is slowing down as we enter May. Supply is now a little higher than normal while demand is far below normal. This is not a healthy combination and market theory postulates that prices will fall while the condition persists.

Although sales volume improved, the number of listings under contract has declined slightly from the beginning of April. In theory, demand should increase as prices decline, but that depends on buyers having confidence that home prices won’t get more attractive if they wait a little bit longer.

Temperatures will soon be entering their peak period in Central Arizona and house hunting in the open air will become less comfortable. In almost every year that means the market slows down and prices weaken. The current closing price dip of over 3% during a single month is unlikely to be reversed in the next 4 or 5 months. It is more likely that the downtrend continues, at least until we enter the fourth quarter.

The most positive trend right now is the increase in transaction volumes, and we hope this will continue for some time. Source Cromford Report

Sellers are currently negotiating and, on average, are offering concessions. It’s essential to market your home effectively by ensuring it is move-in ready and presents well. This is not the time to overprice your home, as buyers have many more options available to them.

I can assist you in selling your home, using our proven marketing strategy and resources to prepare your home for the market and ensure it sells for top dollar.

Call me to discuss your situation if you’re considering selling or buying.

MarketsMy Monthly Market Summary May 5, 2025

Phoenix Housing Market Update May 1, 2025

Our markets have taken a downturn, and I expect downward pressure to persist at least through the 4th quarter. This, however, presents a great opportunity for homebuyers who have been waiting for more favorable terms and better pricing. As the economy slows, interest rates should ease, providing further benefits for homebuyers. Now is the time to act or prepare—waiting for the perfect moment to time the market could mean missing out. Once the market begins to turn around, the window of opportunity will close quickly.
To remain competitive, sellers must be prepared to offer concessions and stay flexible on price, especially if the property isn’t show-ready or in a prime location. The days of listing high and expecting multiple offers are behind us, at least for now.
“Since the housing market peaked in June of 2022, many of you may not be fully aware of where the key statistics stand today.”
These are the housing stats for May of 2022, which was the top in the market:
  • Monthly Average Sales Price per Sq. Ft- May 2022:  $303.55
  • Monthly Median Sales Price- May 2022:  $475,000
And these are housing stats for April of 2025: Today
  • Monthly Average Sales Price per Sq. Ft.: $299.30
  • Monthly Median Sales Price: $445,000
Price Per Sq Ft is down -1.4% in 3 years.
Median Sales Price is down -6.3% in 3 years.
Because the luxury market has remained strong, with significantly higher price points, price-per-square-foot figures can be misleading. The monthly median sales price offers a more accurate and balanced view of the overall housing market.
“Feel free to reach out anytime—it’s more important than ever to work with an experienced agent who can help you confidently navigate today’s challenging market.”  Shawn
Here is the……..
Market Summary for the Beginning of May
Here are the basics – the ARMLS numbers for May 1, 2025 compared with May 1, 2024 for all areas & types:
  • Active Listings: 26,190 versus 17,129 last year – up 53% – and up 4.8% from 24,990 last month
  • Under Contract Listings: 9,047 versus 9,336 last year – down 3.1% – and down 0.7% from 9,113 last month
  • Monthly Sales: 7,303 versus 7,045 last year – up 3.7% – and up 4.89% from 6,967 last month
  • Monthly Average Sales Price per Sq. Ft.: $299.30 versus $306.53 last year – down 2.4% – and down 3.7% from $310.76 last month
  • Monthly Median Sales Price: $445,000 versus $450,000 last year – down 1.1% – and down 3.2% from $459,500 last month
There were 22 working days in both April 2025 and April 2024, so we do not need to make any calendar-based adjustments.
Transaction volumes improved, with closings up 3.7% compared with April 2024. However dollar volume declined, because closed pricing dropped hard between March and April. There are three factors behind this
  1. Higher volumes at the lower end of the market
  2. The top end of the market has slowed down
  3. A general downward trend in prices due to buyers taking increased control of the market.
Supply continued to climb throughout April but the growth rate is slowing down as we enter May. Supply is now a little higher than normal while demand is far below normal. This is not a healthy combination and market theory postulates that prices will fall while the condition persists.
Although sales volume improved, the number of listings under contract has declined slightly from the beginning of April. In theory, demand should increase as prices decline, but that depends on buyers having confidence that home prices won’t get more attractive if they wait a little bit longer.
Temperatures will soon be entering their peak period in Central Arizona and house hunting in the open air will become less comfortable. In almost every year that means the market slows down and prices weaken. The current closing price dip of over 3% during a single month is unlikely to be reversed in the next 4 or 5 months. It is more likely that the downtrend continues, at least until we enter the fourth quarter.
The most positive trend right now is the increase in transaction volumes, and we hope this will continue for some time. Source Cromford Report
Sellers are currently negotiating and, on average, are offering concessions.  It’s essential to market your home effectively by ensuring it is move-in ready and presents well. This is not the time to overprice your home, as buyers have many more options available to them.
I can assist you in selling your home, using our proven marketing strategy and resources to prepare your home for the market and ensure it sells for top dollar.
Call me to discuss your situation if you’re considering selling or buying.
SHAWN KEANE
REALTOR, ARIZONA
(602) 989-3209 Cell
My Monthly Market Summary April 15, 2025

Market Summary for the Beginning of April 2025

Here are the basics – the ARMLS numbers for April 1, 2025 compared with April 1, 2024 for all areas & types:

  • Active Listings: 24,990 versus 17,025 last year – up 47% – and up 4.4% from 23,934 last month
  • Pending Listings: 5,278 versus 5,185 last year – up 1.8% – and up 5% from 5,028 last month
  • Under Contract Listings: 9,113 versus 8,601 last year – up 6.0% – and up 7.6% from 8,471 last month
  • Monthly Sales: 6,939 versus 6,765 last year – up 2.6% – but up 19% from 5,816 last month
  • Monthly Average Sales Price per Sq. Ft.: $311.19 versus $294.09 last year – up 5.8% – but down 0.2% from $311.80 last month
  • Monthly Median Sales Price: $459,500 versus $445,000 last year – up 3.3% – and up 0.1% from $459,000 last month

There were 21 working days in both March 2025 and March 2024, so we do not need to make any calendar-based adjustments.


There is good news and bad news for both sellers and buyers.


The active listing counts continue to rise, which is very unusual between March and April, and therefore bad news for sellers, but the rate of increase has at least slowed down. Interest rates have eased to around 6.63% for the 30 year fixed, and demand shows clear signs of improving during March. Pending listings are higher than last year and listings under contract are up over 6%. The sales count is also stronger (up 2.6% from March 2024). This is encouraging for sellers. The problem remains that even with this higher transaction and contract level, supply is still rising. There are simply more sellers than we expected, with year-to-date new listings almost 20% higher than this time last year.


Closed pricing is still looking surprisingly strong but once again this is heavily skewed by high-end deals that were agreed before pandemonium hit the stock market. The luxury market is highly dependent on how wealthy people feel about their investments, and they have gone from ebullient in early January to despondent in early April. This change is not reflected in closings, but it appears to be making itself felt in active list pricing and under contract counts for the top end of the market.


With the Cromford® Market Index now below 80, the downward pressure on prices is building just as inflation starts to tick up again. The cost of building a home is rising quickly because so many of the physical components are sourced from abroad, but new home selling prices will have to come down when supply exceeds demand to the extent we are now seeing. Despite new home closings in Greater Phoenix reaching the highest level for January and February since 2006, home builders are starting to cut their base prices – KB Home being the first major builder to report doing so. Other builders may be hoping that increasing concessions will work, but just one look at the stock charts for homebuilders is enough to paint the picture clearly. Lennar is currently down 32% over the past 12 months and DR Horton is down 22%. Even Toll Brothers, operating at a much higher median price point, is down 22% from a year ago.


Although there are more buyers about at the moment, they have a lot of choice and growing bargaining power, especially in the outlying and less expensive areas. With patience and care, they should be able to secure a good deal if the seller is realistic about market conditions. If the seller is unrealistic, there is no harm in walking away.


Sign up for Neighborhood News, “the best way to stay connected to what’s happening in the real estate market in your area.


If you’re interested in knowing how much equity you have in your home, reply with the subject line “EQUITY,” and I will send you an equity analysis.


The best compliment is a referral to your family and friends!  Thank you so much!


All the best,

BuyingMarketsMy Monthly Market SummarySelling March 18, 2025

It’s a Buyer’s Market. Why aren’t prices crashing? 3-17-2025

It’s a Buyer’s Market. Why aren’t prices crashing?

Could Economic Uncertainty Help the Housing Market?

For Buyers

Phoenix has been in a buyer’s market for 3 out of the last 4 months, and it’s continuing into March as of this writing. Some buyers may be surprised to see price measures aren’t showing a decline yet, in fact the median is up 4.3% over last year. Price measures take at least 3-6 months to crack after a shift in the market, and that shift needs to be in effect for at least a season before it starts to hit the price line.

Why does it take so long? For a number of reasons, but one is the length of the sale. When selling a home, first the seller needs to list it on the open market and possibly wait 30 days before accepting a contract. Then after another 30-45 days in escrow, the price finally records. Then in order to establish a trend, two more months need to be established to show a measurable decline in price. Stocks, in contrast, can be sold and recorded at the push of a button, so volatility and price responses are instantaneous, and crashes are common.

This is only the 4th buyer’s market for Greater Phoenix over the past 25 years, and the one from 2006 -2008 was a doozy that ignites PTSD for those who suffered through it. Because the housing crash coincided with the Great Recession of 2008, there are some who believe home values are set to crash if another recession should occur in the near future. Historically, this theory is not supported. Typically home values go flat and boring during recessions, or barely rise. Ironically, buyer demand for homes increases during recessions because mortgage rates typically decline. Measures today suggest prices could decline in the coming months if supply continues to rise, but more like a coast or glide, not a crash.

Most price ranges are currently averaging somewhere around 1-2% appreciation year-over-year, which is less than the rate of inflation. However, condominiums and townhomes under $400K are seeing the most notable declines in value, down -4.2% so far this month, while those between $1M-$1.5M are experiencing the strongest growth at +5.5%. Under these circumstances, any drop in mortgage rates will have significant impacts on a buyer’s purchasing power.

For Sellers

Today’s buyer’s market is not due to falling buyer demand. The Cromford® Demand Index is actually rising at the moment. It’s rising supply that’s causing sellers added stress. So far in this year, the Arizona Regional MLS has seen more new listings added to supply than it has in the last 4 years, and the highest total count of active listings since 2015. While buyer demand is improving, it’s not enough to absorb this many added listings. The byproduct is a spike in price reductions over the past 4 weeks (up 58% over last year) and stronger buyer negotiations, even for homes in perfect condition.

The average list price per square foot tells us that sellers are not pushing the market on price as much as they used to, with measures by price range mostly within 1% of last year, give or take. But added pressure from increased competition is causing some sellers to go the extra mile just to get an offer. That could mean staging their vacant home, or neutralizing paint, upgrading appliances, or more.

Once they get the offer, price negotiations are shaving off a tad more than they did last year as well. The average price negotiation for listings under $1M is running at 98.3% of the last list price, down from 98.6% last year. On a $500,000 purchase, that’s a negotiation of $8,500 off the sales price vs. $7,000 last year. Negotiations over $1M are averaging 95.4% compared to 96.4% last year. On a $1M home, that’s a downward negotiation of $46,000 vs. $36,000.

There’s one ray of good news for sellers. Mortgage rates have been trending down since January’s peak of 7.26% and are averaging 6.78% as of this writing per Mortgage News Daily. In the face of perceived chaos and uncertainty over the economy, potential tariffs, and federal government downsizing, the stock market declined as investors moved their money over to more stable investments, including bonds. This pushed down rates on the 10-year treasury, which is closely tied to 30-year mortgage rates. If mortgage rates continue to decline past 6.5%, the market will improve for sellers.  Cromford Report

My Monthly Market Summary March 6, 2025

Market Summary for the Beginning of March 2025

Here are the basics – the ARMLS numbers for March 1, 2025 compared with March 1, 2024 for all areas & types:
  • Active Listings: 23,934 versus 16,568 last year – up 44% – and up 6.7% from 22,432 last month
  • Under Contract Listings: 8,471 versus 8,693 last year – down 2.6% – but up 14% from 7,403 last month
  • Monthly Sales: 5,745 versus 5,757 last year – down 0.2% – but up 21% from 4,733 last month
  • Monthly Average Sales Price per Sq. Ft.: $312.54 versus $292.55 last year – up 6.8% – but down 0.3% from $313.55 last month
  • Monthly Median Sales Price: $459,000 versus $430,000 last year – up 6.7% – and up 1.28% from $453,500 last month
There were 20 working days in February 2025 and 21 in February 2024, so we should allow for the fact that there was 4.8% less time for title companies to close transactions in 2025. In this light, the sales numbers in 2025 look more positive.
The active listing counts continue to rise but at least they did not rise quite as fast as in January. Interest rates have eased to around 6.75% for the 30 year fixed, and demand has started to improve. The problem for sellers is that supply is growing faster than demand so getting a successful sale gets a little harder each day. Conversely for buyers, their negotiation leverage gets a little better each day.
None of this applies to the very top end of the market which is running under new rules. There is strong demand for ultra-luxury homes from wealthy buyers who pay scant attention to interest rates. The activity at this level is skewing the average price per sq. ft. which would be much lower if sales over $3 million are excluded. There were 73 closed sales over $3 million, just over 1% of all transactions, but excluding them drops the average $/SF by 7% to $291 from $313. Those 73 sales over $3 million closed at an average of $882 per sq. ft.
Pricing is under downward pressure in areas with a large excess of supply, such as Maricopa, Buckeye and other outlying areas with plenty of new builds for re-sale homes to compete with. But in much of the market pricing is holding strong. Even in a balanced market we would expect home prices to rise with inflation. We anticipate inflation to increase in 2025 from the more moderate pace of 2024.   Source Cromford Report 
There are currently 44% more single-family detached listings available for sale across Greater Phoenix than one year ago; however, this figure applies to all price ranges. When examining individual price ranges, we observe the following:
   Under $350,000, we have 70% more.
   Between $350,000 and $600,000, we have 51% more.
   Between $600,000 and 1 million, we have 38% more.
   Between 1 million and 3 million, we have 20% more.
   Between 3 million and 7.5 million, we have 21% more.
   Over 7.5 million, we have 4% less than a year ago.
As you can see, inventory has increased at $600,000 and down; most areas are currently experiencing a buyer’s or balanced market. However, Cave Creek and Goodyear are leaning toward a seller’s market, although this situation can change.  As mentioned earlier, the luxury market is in a different class.  Will our busy spring season shift other areas towards a seller’s market?  Right now, supply is higher than demand, and this needs to change.  Lower mortgage rates will help improve the situation, as mortgage applications have surged in recent weeks due to a decrease of about 0.5% in rates.
Sellers are currently negotiating and, on average, are offering concessions.  It’s essential to market your home effectively by ensuring it is move-in ready and presents well. This is not the time to overprice your home, as buyers have many more options available to them.
I can assist you in selling your home, using my proven marketing strategy and resources to prepare your home for the market and ensure it sells for top dollar.
Call me to discuss your situation if you’re considering selling or buying
Uncategorized February 26, 2025

Is an Accessory Dwelling Unit Right for You? Here’s What To Know

Are you having a hard time finding the right home in your budget? Or maybe you already own a home but could use some extra income or a designated space for aging loved ones. Either way, accessory dwelling units (ADUs) could be the smart solution you’ve been looking for in today’s market.

What Is an ADU?

According to Fannie Mae, an ADU is a small, separate living space that’s on the same lot as a single-family home. It must include its own areas for living, sleeping, cooking, and bathrooms independent of the main house. And they can take shape in a few different ways. Fannie Mae adds, an ADU can be:

  • Within a main home, such as a basement apartment
  • Attached to a main home, such as a living area over a garage
  • Detached from the home entirely; it could even be a manufactured home

The Benefits of ADUs

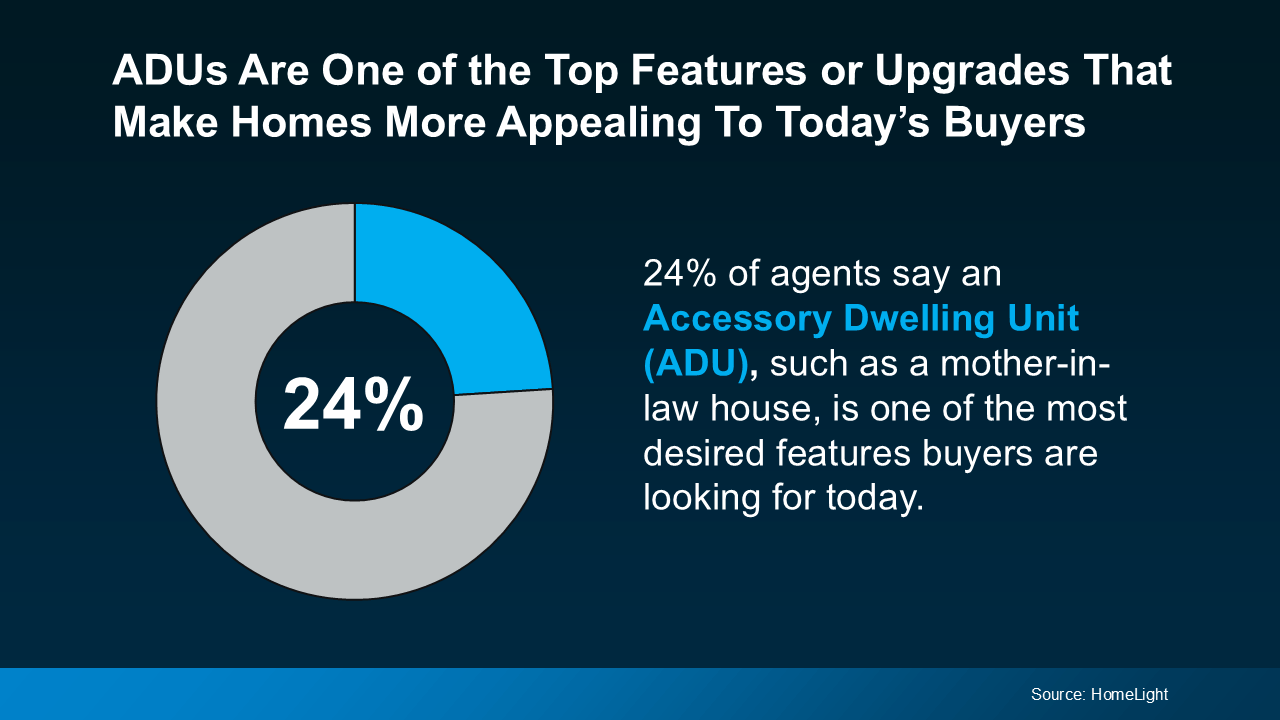
ADUs are growing in popularity as more people discover why they’re so practical. In fact, a recent survey shows that 24% of agents say an ADU, such as a mother-in-law house, is one of the most desired features buyers are looking for right now.

a blue and grey pie chartThe growing appeal makes sense. With rising costs all around you, an ADU can help supplement your income and ease some of the strain on your wallet. Whether you buy a home that has one already or you add one on, it gives you the option to rent out that portion of your home to help pay your mortgage.

Here are some of the other top benefits of ADUs, according to Freddie Mac and the AARP:

  • Living Close, But Still Separate: You get the best of both worlds — more quality time together, plus privacy when you want it. If that sounds like a win, it might be worth looking for a home with an ADU or adding one to your home.
  • Aging in Place: Similarly, ADUs allow older people to be close to loved ones who can help them if they need it as they age. It’s a sweet spot that offers independence and support from loved ones. For example, if your parents are getting older and you want them nearby, this could be a great option for you.
  • Built-In Childcare: If your family’s living in the ADU, you may be able to use them for childcare, which can also be a big cost savings. Plus, it gives your kids more time with their grandparents.

It’s worth noting that since an ADU exists on a single-family lot as a secondary dwelling, it typically can’t be sold separately from the primary residence. And while that’s changing in some states, regulations vary by location. So, connect with a local real estate expert for the most up-to-date guidance.

Bottom Line

In today’s market, buying a home with an ADU or adding one to your current house could be worth considering. Just be sure to talk with a real estate agent who can explain local codes and regulations for this type of housing and what’s available in your area.

What’s your motivation for exploring ADUs?

Buying February 26, 2025

How To Buy a Home Without Waiting for Lower Rates 2025 Feb

Many people are hoping mortgage rates will come down before they buy a home. But will that actually happen? According to the latest forecasts, experts say rates will decline, but not by as much as a lot of people want.

The good news? Even if they don’t drop substantially, there are still ways to make buying a home more affordable.

How Much Will Rates Drop?

A few months ago, experts were forecasting mortgage rates could dip below 6% by the end of the year. But recent projections suggest that may not happen after all.

While mortgage rates are still expected to decline some later this year, projections from Fannie Mae, the Mortgage Bankers Association (MBA), and Wells Fargo now show them stabilizing closer to 6.5% by the end of the year (see below):

a blue and white graph with numbers and textThat means if you’re holding off on buying a home in hopes of much lower mortgage rates, you may be waiting a while. And if you need to move because something in your life has changed, like a new job, a new baby, or a marriage – waiting that long may not be an option.

Creative Financing Options in Today’s Market

Since rates aren’t expected to decline as much as originally expected, it may be worth considering alternative financing options that could help you get into a home sooner rather than later. Here are three strategies to discuss with your lender to see if any of these make sense for you:

1. Mortgage Buydowns

A mortgage buydown allows you to pay an upfront fee to lower your mortgage rate for a set period of time. This can be especially helpful if you want or need a lower monthly payment early on. In fact, 27% of agents say first-time homebuyers are increasingly requesting buydowns from sellers in order to buy a home right now.

2. Adjustable-Rate Mortgages

Adjustable-rate mortgages (ARMs) typically start with a lower mortgage rate than a traditional 30-year fixed mortgage. This makes them an attractive option, especially if you expect rates to drop in the coming years or plan to refinance later.

And if you remember the housing crash, know that today’s ARMs aren’t like the risky ones back then. Lance Lambert, Co-Founder of ResiClub, helps drive this point home by saying:

. . . ARM products today are different from many of the products issued in the mid-2000s. Before 2008, lenders often approved ARMs based on borrowers ability to pay the initial lower interest rates. And sometimes they didn’t even check that (remember Ninja loans). Today, adjustable-rate borrowers qualify based on their ability to cover a higher monthly payment, not just the initial lower payment.”

In simple terms, banks used to give loans without checking to see if buyers could afford them. Now, lenders verify income, assets, and jobs, reducing the risks associated with ARMs compared to the past.

3. Assumable Mortgages

An assumable mortgage allows you to take over the seller’s existing loan — including its lower mortgage rate. And with more than 11 million homes qualifying for this option according to U.S. News, it’s worth exploring if you want or need a better rate.

Bottom Line

Waiting for a big decline in mortgage rates may not be the best strategy. Instead, options like buydowns, ARMs, or assumable mortgages could make homeownership more affordable right now. Connect with a local lender to explore what works for you.

How does this impact your homebuying plans this year?