Facebook
 X
X
 Pinterest
 Copy Link

What is Phoenix Metro Housing looking like for 2026? Up or Down?
The Phoenix Metro Outlook for 2026 calls for moderate, sustainable home price growth shaped by continued demand, easy rates, and balanced inventory dynamics. Affordable and mid-range homes are expected to outperform luxury segments in price gains. The market is shifting toward balanced growth rather than the double-digit boom seen in the past.
I’m in the camp that we will see a modest rise, not a decline, this year. Most predictions indicate that the metro area will see modest growth, with gains expected to range from approximately +2% to +5%. I believe +5% is aggressive. It’s likely to be more in the 1-3% range, which is good news for sellers and buyers alike if buyers get in early.
Continued population and job growth in the Valley support demand. Phoenix remains one of the fastest-growing large metro areas in the US.
I will have an even better pulse on the market given the direction of January’s numbers. As always, I’m on it! Shawn
—————————————————————————————————————–Now to December’s numbers:
Market Summary for the Beginning of 2026
Here are the basics – the ARMLS numbers for January 1, 2026 compared with January 1, 2025 for all areas & types:
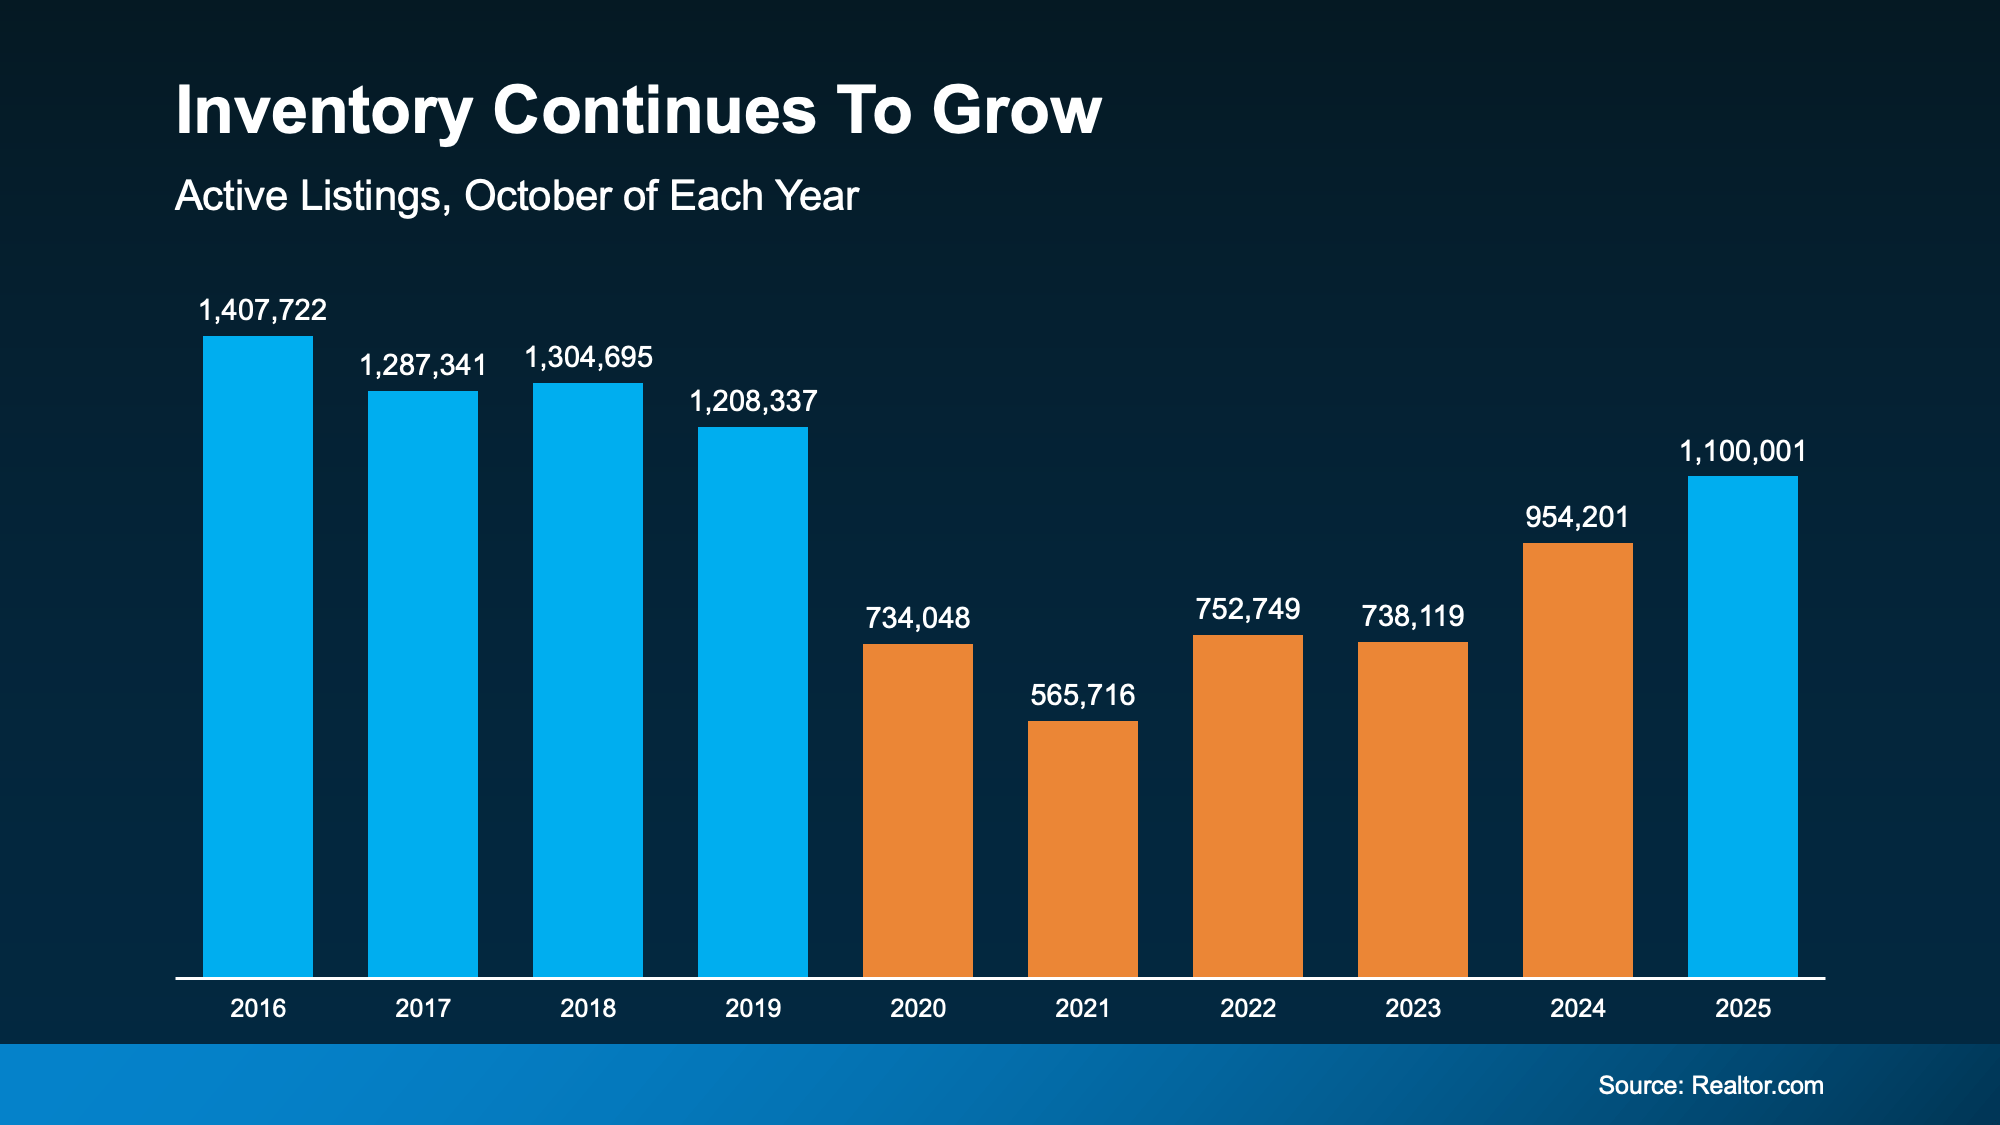
- Active Listings: 22,248 versus 20,007 last year – up 12% – but down 9.0% from 24,653 last month
- Under Contract Listings: 5,782 versus 5,496 last year – up 5.2% – but down 20% from 7,191 last month
- Monthly Sales: 6,374 versus 5,576 last year – up 14% – and up 18% from 5,396 last month
- Monthly Average Sales Price per Sq. Ft.: $303.80 versus $302.98 last year – up 0.3% – and up 2.4% from $296.69 last month
- Monthly Median Sales Price: $455,000 versus $450,000 last year – up 1.1% – and up 1.1% from $450,000 last month
Supply continued to fall throughout December and we ended the year down 10% from the end of November. However we still have 12% more supply than we had at the start of 2025, so plenty of choice remains available for most buyers. We would also expect a lot of new listings over the next 12 weeks, some of which are going to be homes whose listings were cancelled or expired in the last 2 months.
The month of December was relatively strong for closings, with more expensive homes dominating in the first 2 weeks and less expensive homes growing more numerous in the last week of the year. The total closing count of 6,374 was up more than 14% compared with December 2025, so is a very respectable total. Despite the holidays there were 22 working days in December 2025, one more day than in December 2024. This gave last month an advantage of 4.8% but since closings were up 14.3% we can count December 2025 as a big win.
A side-effect of such a strong closing number is that listings under contract fell 20% between start of December and the start of January. However the count is still up over 5% from the start of 2025 so we are counting that as a win too.
The healthy numbers of luxury homes that closed in the first 2 weeks of December drove December’s average closed $/SF up by 2.4%. However we ended 2025 up only 0.3%, almost flat with the end of 2024. Median sales prices are not helped much by luxury homes and ended up $5,000 from both November 2025 and December 2024. Not a very significant change.
Sales prices up slightly year over year reinforces confidence in the market but improves affordability because median household incomes rose faster than home prices last year.
Everything now depends on how trends develop during January. Will we see a strong flow of new listings (as we did in 2025) or will supply remain subdued as it was in the last 2 months? Will demand benefit from interest rates which are currently lower than almost the whole of 2025?
Greater Phoenix’s housing market has out-performed low expectations since October and is currently heading back towards the balanced zone.
Overall, things look good for buyers and better for sellers than they experienced during most of last year. But the next few weeks are key to whether that outlook holds. Source Cromford Report
—————————————————————————————————————–
For Tina Tamboer, senior housing analyst with the Cromford Report, the past 18 to 24 months hasn’t been a downturn. It’s a normalization.
“When we say it’s a buyer’s market, I don’t want people to freak out. It’s not the kind of buyer’s market we saw in 2008,” Tamboer says. “This is a market where buyers can actually negotiate again. That’s not a bad thing.”
Tamboer tracks the Valley’s demand-to-supply index, where 100 represents balance. Above 110 signals a seller’s market; below 90, leverage tilts toward buyers. As the new year begins, the index sits around 80, a level she describes as “the best buyer opportunity we’ve seen in years.”
The underlying reason isn’t excess inventory like it has been in the past.
“It’s because demand has been so suppressed,” she explains. “We’re not anywhere close to oversupply. Builders aren’t overproducing and existing homeowners are still locked into low rates.”
Nationally, 80% of homeowners hold a mortgage rate below 5%, a structural headwind against listings returning to pre-pandemic norms.
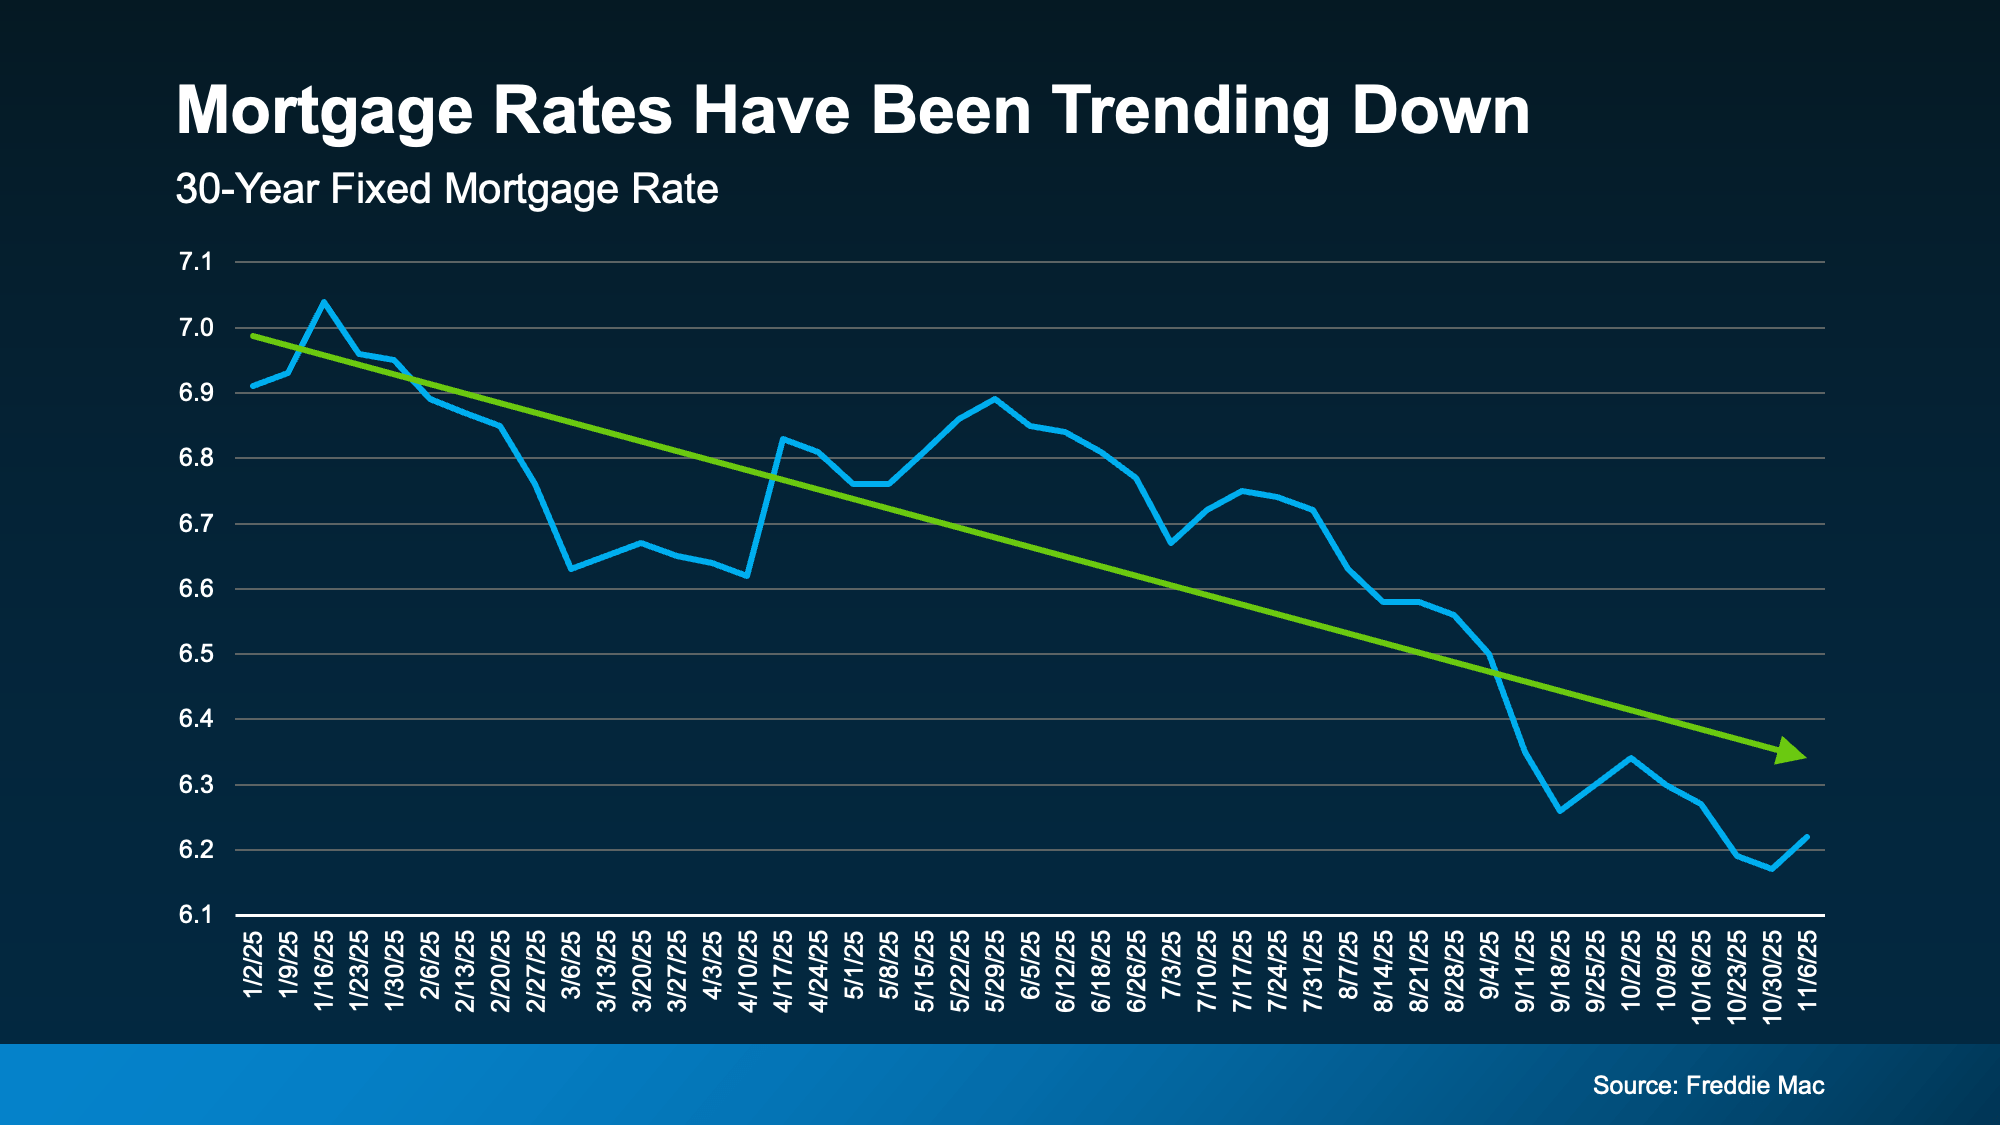
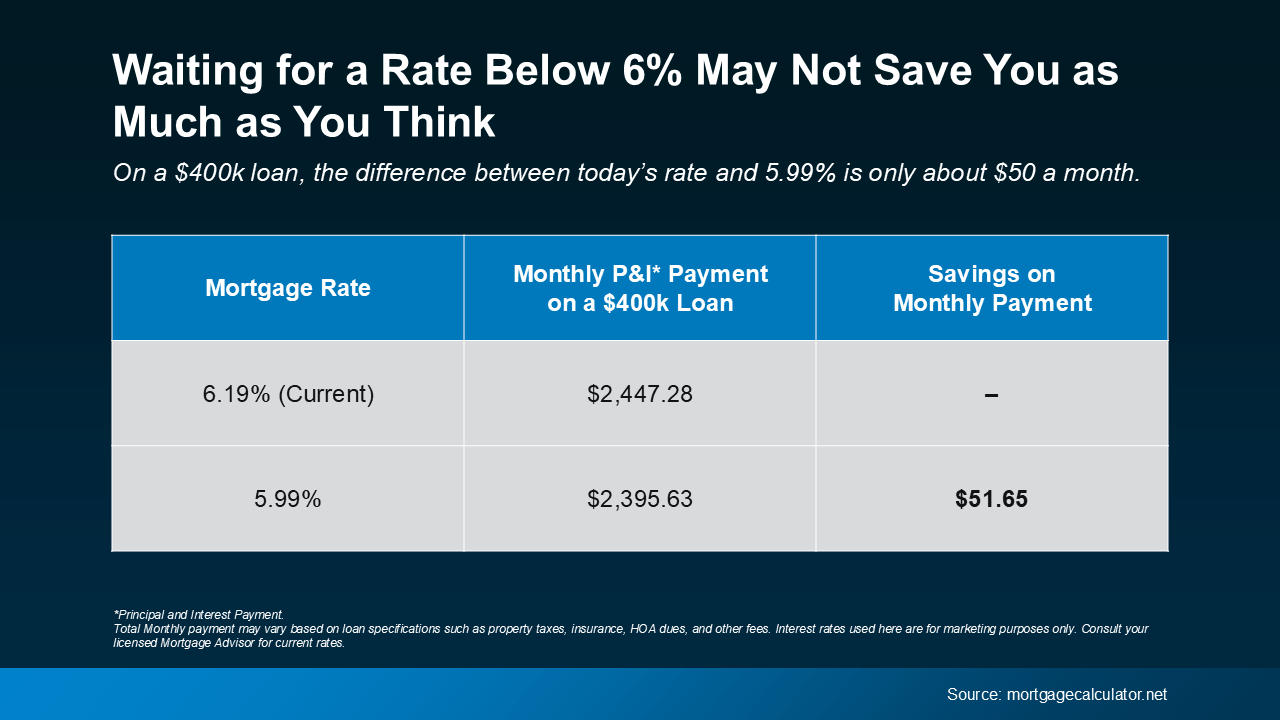
Still, market activity has improved recently. Mortgage rates, which spiked past 7% in 2023, have held in the low 6% range long enough to rebuild buyer confidence. Tamboer notes that stability matters far more than rate drops.
“In January 2025, rates fell dramatically and people didn’t rush in,” Tamboer says. “They wanted to see if rates would keep dropping. It’s not falling rates that matter, it’s stable rates. People move when they feel like the rate they’re getting today will still be there tomorrow.”
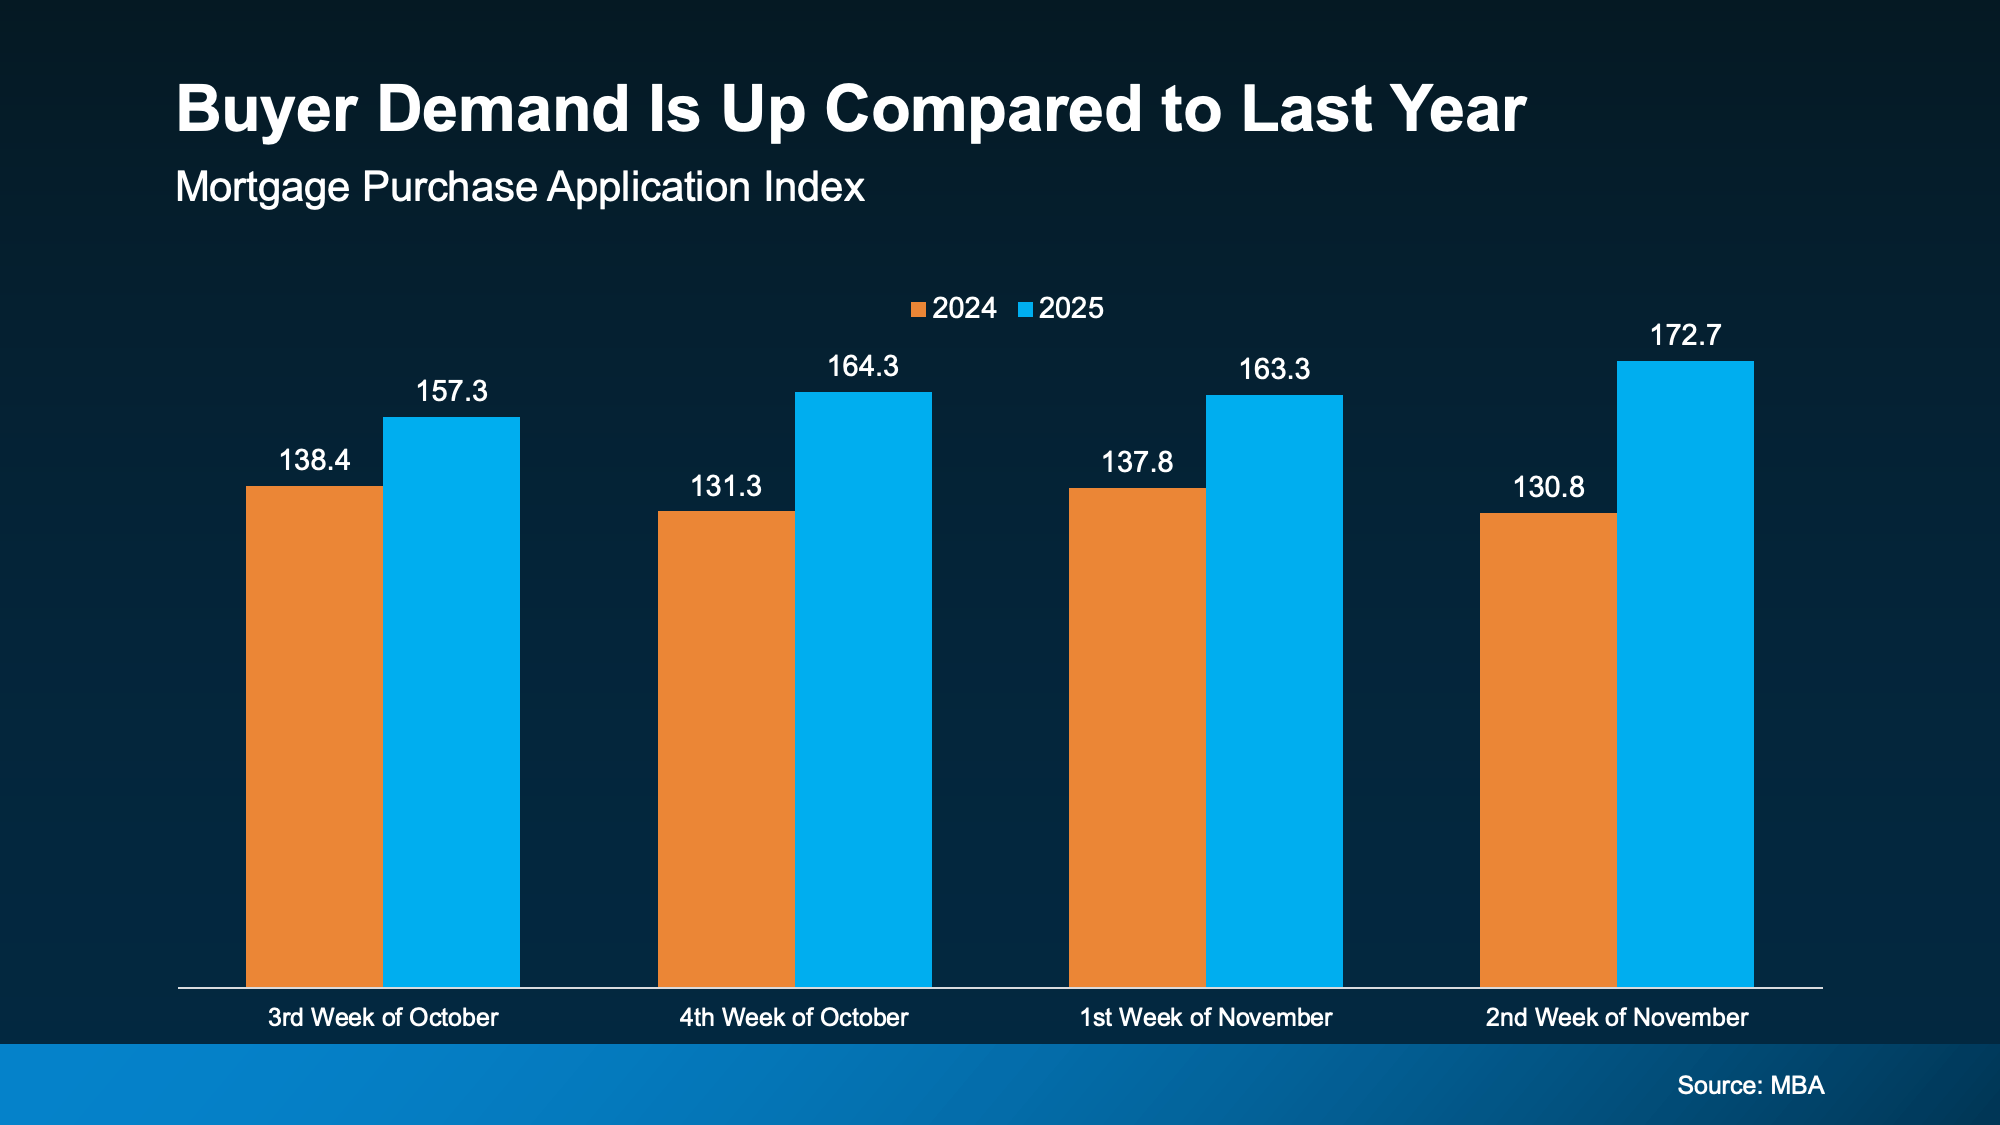
Sales have followed suit. Closed transactions have risen from their 2023 trough and pending sales through 2025 moved closer to seasonal norms. Even with these positive factors, buyers still remain wary and cautious.
Segments under $1 million have softened roughly 2%-3%, while certain mid-tier neighborhoods remain down 10%-15% from their pandemic peaks. Condos have struggled where single-family homes now offer more space for similar prices. The luxury segment, which Tamboer notes is now tied more to the stock market than mortgage rates, continues to buoy median sales prices.
And then there’s the return of concessions, a hallmark of the Valley’s new bargaining power dynamic. More than half of transactions between $200,000 and $600,000 include concessions and builders have extended buydowns and closing-cost incentives longer than many expected. Source Tina Tambour Cromford Report AZ
—————————————————————————————————————
The market may shift, trends may change, but my commitment doesn’t. Strategic guidance, elevated marketing, and a client-first approach to every transaction, every time. The standard has always been high, and it stays that way. If 2026 is your year, I’m here to guide you through it. Shawn
(602) 989-3209 Cell