My Monthly Market Summary October 6, 2023

Housing Market Summary for the Beginning of October 2023

Housing Market Summary for the Beginning of October

Hello,

September’s spike in mortgage rates resulted in more buyers postponing their home searches.

We have a higher increase of new listings in September compared to August which is unusual, and this coincides with more price reductions on listings.

I still predict that home prices will be generally flat through the end of the year, however the risk of further price declines has increased. We need to see interest rates stabilize, come down and the Federal Reserve to signal to the markets that they are done increasing rates. Pent-up demand is there; however, affordability and 20-year high mortgage rates have priced many buyers out of the market.  Shawn

Here are the basics – the ARMLS numbers for September 1, 2023 compared with September 1, 2022 for all areas & types:

  • Active Listings: 13,404 versus 20,084 last year – down 33% – but up 12% from 11,969 last month
  • Pending Listings: 4,264 versus 4,862 last year – down 12% – and down 7.4% from 4,604 last month
  • Under Contract Listings: 6,499 versus 7,358 last year – down 12% – and down 8.6% from 7,111 last month
  • Monthly Sales: 5,563 versus 6,460 last year – down 14% – and down 11% from 6,261 last month
  • Monthly Average Sales Price per Sq. Ft.: $285.08 versus $276.60 last year – up 3.1% – and up 1.1% from $281.99 last month
  • Monthly Median Sales Price: $432,000 versus $439,000 last year – down 1.6% – and down 0.7% from $435,000 last month

Mortgage rates 7.85% have hit their highest levels in 20 years and the impact on demand can be seen in the numbers. Listings under contract fell another 8.6% from the dismal level of last month. Closed sales were also disappointing, dropping another 11% from last month.

New listings remain scarce, but the flow has increased over the last 2 months. Demand is so poor that the active listing count is starting to build, up 12% over the last month. However, it remains well below last year at this time.

Price readings have something for everyone, with the average $/SF for closed listings up sharply and now over 3% higher than this time last year. However, the median sales price is 1.6% below last year and slightly lower than last month. This strange and unusual behavior is caused by pricing at the high end remaining stronger than it is at the low end.

The balance between supply and demand still favors sellers in the majority of markets, but negotiating power is swinging towards buyers with every day that passes. Supply rising and demand falling means this trend is gathering strength. If interest rates remain in the high sevens or increase further, then we can expect market balance to hit within 2 months or so. However, we usually see a significant weakening of supply from the middle of November to the end of the year and this could temper the downward direction in the Cromford® Market Index.

Demand remains much better in the new home market, though even here buyers will find it increasingly hard to qualify for loans if interest rates get closer to 8%.

A year ago, the market was looking very weak, and few people imagined that $/SF could possibly go up 3% in the following 12 months. This reinforces how unpredictable the market can be when looking more than a couple of months out. The best that can be done with math is a well-defined interpretation of the trend during the next 8 weeks or so. Right now these 8 weeks are not looking rosy. Just remember we felt the same way in October 2022. 

Source: AZ Cromford Report 

Check out my website which is full of information and a special feature called “Neighborhood News” “the best way to stay connected to what’s happening in the real estate market in your area”.   Also, you can search real time listings in any area of the market.  Check it out and stay updated with my daily blog and monthly market report that I send out monthly.  My Website–Find Your Dream Home

If you’re considering selling or buying, give me a call to discuss your situation and current market conditions.  


I love referrals! Please remember me! Thank you, Shawn, your realtor.

Uncategorized September 14, 2023

Things to Consider When Buying a Home 9/2023 Fall Edition

Things to Consider When Buying a Home

The process of buying a home can be overwhelming at times, but you don’t need to go through it alone. You may be wondering if now is a good time to buy a home … or if interest rates are projected to rise or fall. I put together a free eGuide for you that will answer many of your questions and likely bring up a few things you haven’t even thought about yet. Just click the button below to read it now!

Read Your Guide Now

Uncategorized September 14, 2023

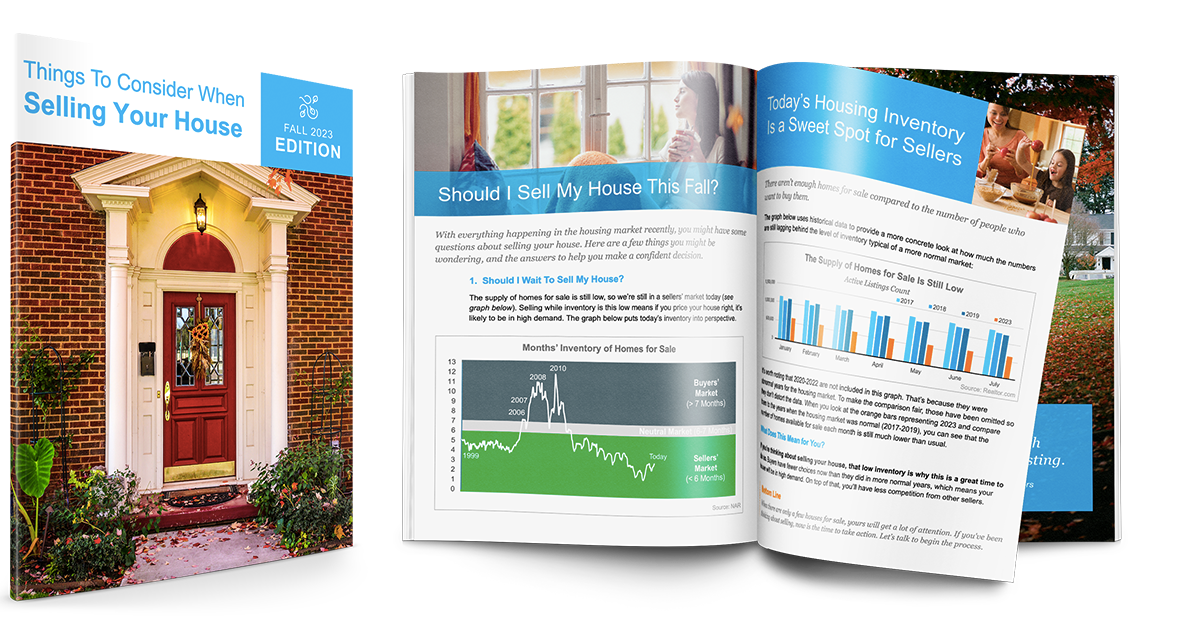
Things to Consider When Selling Your House 9/2023 Fall Edition

Things to Consider When Selling Your House

It’s difficult to know when is the best time to sell, or how to get the most money for your house, but you don’t need to go through the process alone.

You may be wondering if prices are projected to rise or fall… or how much competition you may be facing in the market. I put together a free eGuide for you that will answer many of your questions and likely bring up a few things you haven’t even thought about yet. Just click the button below to read it now!

Read Your Guide Now

Uncategorized September 14, 2023

Planning to Retire? Your Equity Can Help You Make a Move

Planning to Retire? Your Equity Can Help You Make a Move

Reaching retirement is a significant milestone in life, bringing with it a lot of change and new opportunities. As the door to this exciting chapter opens, one thing you may be considering is selling your house and finding a home better suited for your evolving needs.

Fortunately, you may be in a better position to make a move than you realize. Here are a few reasons why.

Consider How Long You’ve Been in Your Home

From 1985 to 2009, the average length of time homeowners stayed in their homes was roughly six years. But according to the National Association of Realtors (NAR), that number is higher today. Since 2010, the average home tenure is just over nine years (see graph below):

This means many homeowners have been living in their houses even longer in recent years. When you live in a home for such a significant amount of time, it’s natural for you to experience changes in your life while you’re in that house. As those life changes and milestones happen, your needs may change. And if your current home no longer meets them, you may have better options waiting for you.

Consider the Equity You’ve Gained

And, if you’ve been in your home for more than a few years, you’ve likely built-up substantial equity that can fuel your next move. That’s because you gain equity as you pay down your loan and as home prices appreciate. And, the longer you’ve been in your home, the more you may have gainedData from the Federal Housing Finance Agency (FHFA) illustrates that point (see graph below):

While home prices vary by area, the national average shows the typical homeowner who’s been in their house for five years saw it increase in value by nearly 60%. And the average homeowner who’s owned their home for 30 years saw it almost triple in value over that time.

Whether you’re looking to downsize, relocate to a dream destination, or move so you live closer to friends or loved ones, that equity can help. Whatever your home goals are, a trusted real estate agent can work with you to find the best option. They’ll help you sell your current house and guide you as you buy the home that’s right for you and your lifestyle today.

Bottom Line

As you plan for your retirement, let’s connect so we can find out how much equity you’ve built up over the years and plan how you can use it toward the purchase of a home that fits your changing needs.

Uncategorized September 14, 2023

What Experts Project for Home Prices Over the Next 5 Years

What Experts Project for Home Prices Over the Next 5 Years

If you’re planning to buy a home, one thing to consider is what experts project home prices will do in the future and how that might affect your investment. While you may have seen negative news over the past year about home prices, they’re doing far better than expected and are rising across the country. And data shows, experts forecast home prices will keep appreciating.

Experts Project Ongoing Appreciation

Pulsenomics polled over 100 economists, investment strategists, and housing market analysts in the latest quarterly Home Price Expectation Survey (HPES). The results show what the panelists project will happen with home prices over the next five years. Here are those expert forecasts saying home prices will go up every year through 2027 (see graph below):If you’re someone who was worried home prices would fall because of stories you’ve read online, here’s the big takeaway. Even though home prices vary by local market, experts project prices will continue to rise across the country for years to come. And these numbers indicate the return to more normal home price appreciation.

And while the projected increase in 2024 isn’t as large as 2023, it’s important to recognize home price appreciation is cumulative. In other words, if these experts are correct, after your home’s value rises by 3.32% this year, it’ll appreciate by another 2.17% next year. This is a good example of why owning a home is a choice that wins big over time.

What Does This Mean for You?

Once you buy a home, price appreciation raises your home’s value, and that grows your household wealth. To see how a typical home’s value could change in the next few years using the expert projections from the HPES, check out the graph below:In this example, let’s say you bought a $400,000 home at the beginning of this year. If you factor in the forecast from the HPES, you could potentially accumulate more than $71,000 in household wealth over the next five years.

So, if you’re thinking about whether buying a home is a good choice, remember how it can be a powerful way to grow your wealth in the long run.

Bottom Line

According to the experts, home prices are expected to grow over the next five years at a more normal pace. If you’re ready to become a homeowner, know that buying today can set you up for long-term success as home values (and your own net worth) grow. Let’s connect to start the homebuying process today.

My Monthly Market Summary September 7, 2023

Market Summary for the Beginning of September 2023

Market Summary for the Beginning of September 2023

Here are the basics – the ARMLS numbers for September 1, 2023 compared with September 1, 2022 for all areas & types:

  • Active Listings: 11,969 versus 18,694 last year – down 36% – but up 6.5% from 11,241 last month
  • Pending Listings: 4,604 versus 5,607 last year – down 18% – and down 4.9% from 4,842 last month
  • Under Contract Listings: 7,111 versus 8,419 last year – down 16% – and down 5.8% from 7,546 last month
  • Monthly Sales: 6,211 versus 5,916 last year – up 5.0% – but down 1.7% from 6,317 last month
  • Monthly Average Sales Price per Sq. Ft.: $282.52 versus $286.71 last year – down 1.5% – but up a tiny 0.01% from $282.48 last month
  • Monthly Median Sales Price: $435,000 versus $444,900 last year – down 2.2% – but up a tiny 0.02% from $434,900 last month

Despite comparisons becoming easier with last year, the market still looks in poor shape. We can see that demand is very weak with listings under contract, down 16% from this time last year. The August closing count offers some relief from the gloom, rising 5% from August 2022, but with the 30-year fixed mortgage rate still north of 7%, qualified buyers are thin on the ground.

Sellers are also scarce. Some simplistic commentators are obsessed with imaginary bubbles and assume that if demand is weaker then prices will fall. Not the case. The fact that so many people think we are in a bubble is conclusive evidence that we are not in a bubble. The important measure is the balance between supply and demand, not demand on its own. Supply has been low for several years apart from the brief surge in the summer of last year. This was caused by panic among iBuyers and speculators, both trying to exit the market in too much of a hurry. At the moment supply is down more than demand is down, so prices are firm.

Without a large and prolonged increase in sellers, we won’t have the lop-sided market that causes prices to fall. We do have a small increase in supply compared with last month, but we are still down 36% from this time last year. If supply continues to grow at 6% or more for six months or more, then we could get back close to a balanced market, but now we are seeing just the usual seasonal pattern. Supply tends to expand from August until mid-November and then contract again.

It might seem that prices are weakening given that the median sales price is $435,000, having been $443,000 two months ago. This is a drop of 1.8%. However, luxury home sales are relatively scare in July and August, and we can see evidence of this from the fall in the average home size between June and August. This dropped almost 3% from 2,022 to 1,965 over the same two months, so median prices falling less than 2% tells us the underlying trend is still positive. The luxury home market share and average home size will no doubt bounce back in October and we should be able to see the upward trend reasserting itself more visibly.

HOUSING AFFORDABILITY in Arizona and nationally took another hit in the second quarter of 2023 primarily due to rising home prices and higher interest rates based on the latest National Association of Homebuilders/Wells Fargo Housing Opportunity Index released August 10. Nationally, 40.5% of new and existing houses sold in the second quarter were affordable to families earning the U.S. median income of $96,300. This was down from 45.6% in the first quarter, but still better than the fourth quarter of 2022 which was the lowest recorded measure (at 38.1%). Housing affordability was lower in all Arizona metropolitan areas for the second quarter of 2023 after increasing across the board in the first quarter of the year. In descending order, the share of affordable homes in Arizona were 60.8% in Sierra Vista-Douglas, 54.4% in Yuma, 41.7% in Lake Havasu City-Kingman, 38.6% in Tucson, 30,1% in Phoenix, 27.3% in Flagstaff and 23.5% in Prescott Valley-Prescott. House prices increased in nearly all Arizona metropolitan areas in the second quarter, with only Flagstaff and Lake Havasu City-Kingman posting slight decreases.

Check out my website which is full of information and a special feature called “Neighborhood News” “the best way to stay connected to what’s happening in the real estate market in your area”.   Also, you can search real time listings in any area of the market.  Check it out and stay updated with my daily blog, monthly market reports and so much more.  My Website–Find Your Dream Home

If you’re considering selling or buying, give me a call to discuss your situation and current market conditions.

I love referrals! Please remember me! Thank you, Shawn, your realtor.

My Monthly Market Summary September 6, 2023

Market Summary for the Beginning of 2023

Here’s to a bright New Year and a fond farewell to the old; here’s to the things that are yet to come, and to the memories that we hold.
– May You Have A Prosperous New Year!
“The future belongs to those who believe in the beauty of their dreams.” – Eleanor Roosevelt
Market Summary for the Beginning of 2023
Here are the basics – the ARMLS numbers for January 1, 2023 compared with January 1, 2022 for all areas & types:
  • Active Listings: 16,298 versus 5,776 last year – up 182% – but down 14.9% from 19,155 last month
  • Pending Listings: 3,657 versus 6,539 last year – down 44.1% – and down 15.0% from 4,301 last month
  • Under Contract Listings: 5,456 versus 9,393 last year – down 41.9% – and down 14.1% from 6,352 last month
  • Monthly Sales: 5,132 versus 9,265 last year – down 44.6% – but up 4.1% from 4,931 last month
  • Monthly Average Sales Price per Sq. Ft.: $265.58 versus $267.92 last year – down 0.9% – and down 2.5% from $272.30 last month
  • Monthly Median Sales Price: $410,000 versus $425,000 last year – down 3.5% – and down 2.4% from $420,000 last month
There are lots of small numbers in December’s totals. We have very low volumes of closings because both buyers and sellers are discouraged. Monthly sales are down almost 45% from this time last year, and listings under contract are down nearly 42%. The numbers confirm that demand is very weak compared to normal for the time of year, and even weaker compared to the strong demand 12 months ago. However weak demand does not necessarily make a market crash. Excess supply is what really drives prices down hard. This is what we saw in 2006 through 2008. But in 2023 supply is low and getting lower. It is much higher than this time last year, when it was abnormally low, but it is still a long way below normal.
Activity is very low across the board, but the market balance is normal. By that we mean we have equal balance between buyers and sellers. The trend is now moving in favor of sellers, having been favorable to buyers a month ago. So although there is gloom and despondency almost everywhere, amid the murk there are clear signs of improvement. Because sentiment is so poor, there is psychological pressure to lower prices. However there is no such downward pressure coming from the market. If all trading was done by unemotional computers, prices should be stabilizing right now.
In the real world, strongly influenced by human emotions, prices fell sharply last month, losing 3.5% in the monthly median and 2.5% based on the average price per square foot. However sales prices are a trailing indicator and these moves reflect the balance in the market in November, when we experienced a clear advantage for buyers. Leading indicators are looking more positive. This probably stems from interest rates being less horrible than they were six weeks ago. Demand is starting to stabilize and even showing a few signs of a slow recovery. With new supply very weak, we are not witnessing a market crash. This is merely a correction, with prices now just a tad lower than a year ago – the monthly average $/SF is down 0.9%.
We are still dependent on the whims of the Federal Reserve. If they continue to push the Federal Funds Rate higher in an attempt to curb inflation, then mortgage rates could move higher too, putting a quick damper on any recovery in demand. However if the 30 year fixed mortgage rate stays between 6% and 6.75%, then we should have confidence that the housing market can operate normally at this level. Prior to 2009, anything under 7% was considered a low interest rate and rates under 5% were unheard of.
To achieve confidence we need several months of interest rate stability. This is by no means certain to happen, but it is possible. Once the fear is removed, we should see more signs of a recovery in demand and volumes will rise back towards a more normal level.
New supply is still very low, but we will be watching closely for any change in this trend.
If you’re considering selling or buying give me a call to discuss your situation and current market conditions.
I love referrals! Please remember me! Thank you, Shawn, your Realtor.
My Monthly Market Summary September 6, 2023

Market Summary for the Beginning of February 2023

Market Summary for the Beginning of February
Here are the basics – the ARMLS numbers for February 1, 2023 compared with February 1, 2022 for all areas & types:
  • Active Listings : 15,598 versus 4,876 last year – up 220% – but down 4.3% from 16,298 last month
  • Pending Listings: 5,109 versus 7,798 last year – down 34% – but up 40% from 3,657 last month
  • Under Contract Listings: 7,810 versus 11,302 last year – down 31% – but up 43% from 5,456 last month
  • Monthly Sales: 4,346 versus 7,098 last year – down 39% – and down 15% from 5,139 last month
  • Monthly Average Sales Price per Sq. Ft.: $267.82 versus $274.42 last year – down 2.4% – but up 0.7% from $266.01 last month
  • Monthly Median Sales Price: $410,000 versus $433,500 last year – down 5.4% – but unchanged from last month
Closed sales hit a very low level during January at 4,346. This is down 39% from January 2022 but January is always a very slow month for closings and it is always darkest just before the dawn. Demand was very weak during the fourth quarter of 2022 but has staged a strong recovery for the start of the new year. We can see this from listings under contract, which are up 43% from a month ago, and from pending listings which are up 40%. These are the strongest month to month percentage gains that we have ever seen, largely because we were starting from such a low base.
Clearly buyers now have a lot more enthusiasm than they did in December. This is bringing down the counts of active listings . This is very unusual for January, a month in which we expect to see lots of new listings. Indeed new listings are up from a weekly rate of less than 700 in late December to over 2,000 a week at the end of January. Despite the huge increase in new listings, overall supply is falling because so many are going under contract. We also have fewer new listings than we did last year when we saw over 2,250 per week.
An interest rate of around 6% would have been considered horrendous this time last year, but now it seems quite reasonable compared with rates over 7% that we witnessed in October and early November. It is also becoming commonplace for sellers to assist buyers in buying down their interest rate still further. Together with improving stability and confidence, this has helped rebuild demand which has recovered more in the last 4 weeks than we anticipated. This trend is building on the positive signs we reported during the second half of December.
Volumes are still well below normal, but they are recovering nicely and promise better times when the Spring buying season gets fully underway.
The appropriate emotional reaction to the market has now changed from despair in December to skepticism in January and relief in February. We look forward to hope building during March.
The last 10 months have seen the most rapid market cycle in history. but it is becoming clear that the worst is now several months behind us.
If you’re considering selling or buying give me a call to discuss your situation and current market conditions.
I love referrals! Please remember me! Thank you, Shawn, your Realtor.
My Monthly Market Summary September 6, 2023

Market Summary for the Beginning of March 2023

Market Summary for the Beginning of March

Here are the basics – the ARMLS numbers for March 1, 2023 compared with March 1, 2022 for all areas & types:

  • Active Listings: 14,739 versus 4,588 last year – up 221% – but down 5.5% from 15,598 last month
  • Pending Listings: 5,911 versus 8,333 last year – down 29% – but up 15.7% from 5,109 last month
  • Under Contract Listings: 7,810 versus 12,050 last year – down 24% – but up 16.6% from 7,810 last month
  • Monthly Sales: 5,693 versus 7,993 last year – down 29% – but up 31% from 4,357 last month
  • Monthly Average Sales Price per Sq. Ft.: $271.14 versus $284.56 last year – down 4.7% – but up 1.2% from $267.83 last month
  • Monthly Median Sales Price: $413,000 versus $445,000 last year – down 7.2% – but up 0.7% from $410,000 last month

Volumes remain much lower than a year ago, but they have recovered some ground. Monthly sales were down 29% compared with 2022, which is a major improvement on the 39% deficit last month.

Although the market remains unhealthy from a volume perspective, it is warming up from a supply versus demand point of view. The supply of active listings has been trending lower for several months, although this is not true of the luxury sector, and particularly Paradise Valley. You might expect demand to be very weak because mortgage rates have jumped back over 7% again. However, buyers are not capitulating and the growth of listings under contract is much healthier than we expected under these circumstances. The 16.6% growth in listings under contract since the beginning of February, and the 31% increase in the monthly sales rate are surprisingly strong.

The balance between supply and demand has shifted significantly over the past 3 months and there is now upward pressure on pricing once more. We note that the monthly median sales price is up 0.7% over the last month while the average price per square foot for closed listings has risen by 1.2%. Pricing remains weaker than a year ago, when we were still in a boom period with exceptionally low supply. But the trend is now pointing higher, not lower. It is possible that the Federal Reserve may do more damage to interest rates, but the risk premium in mortgage rates is currently far above normal. This means there is plenty of scope for lower mortgage rates to be introduced if the risk abates.

The current pricing trend may contradict the claims by various amateur pundits and their daft YouTube channels, but there is almost no data that supports the theory that prices are going to collapse from this point. For this to happen we would need to have a wave of new supply creating problems for sellers. While this is always a remote possibility, there is very little foreclosure activity and low levels of mortgage delinquency. So where is this flood of homes for sale supposed to come from. The builders have cut back drastically on new home permits, so we are more likely to see a shortage of homes for sale than a glut. And rising mortgage rate discourages homeowners with mortgages from selling because that would mean the loss of their cheap loan and the acquisition of a much more expensive one.

Even though buyers are scarce, homes for sale remain stubbornly hard to find. It is always good for sellers when they have less competition from other sellers. This means much less need to cut their asking price, especially if they are patient and present their property well.

If you’re considering selling or buying give me a call to discuss your situation and current market conditions.  If you’re on the sidelines waiting to buy because you think there will be more down-turn or a crash in the market that’s a mistake, this is the time to buy……

I love referrals! Please remember me! Thank you, Shawn, your Realtor.

My Monthly Market Summary September 6, 2023

Market Summary for the Beginning of April

Market Summary for the Beginning of April

Here are the basics – the ARMLS numbers for April 1, 2023 compared with April 1, 2022 for all areas & types:

  • Active Listings : 13,933 versus 5,051 last year – up 176% – but down 5.5% from 14,739 last month
  • Pending Listings: 5,701 versus 8,008 last year – down 29% – and down 3.6% from 5,911 last month
  • Under Contract Listings : 8,935 versus 11,620 last year – down 23% – and down 1.9% from 9,109 last month
  • Monthly Sales: 7,540 versus 10,141 last year – down 25% – but up 32% from 5,706 last month
  • Monthly Average Sales Price per Sq. Ft.: $277.60 versus $290.80 last year – down 4.5% – but up 2.4% from $271.08 last month
  • Monthly Median Sales Price: $419,900 versus $456,000 last year – down 7.9% – but up 1.7% from $413,000 last month

The market continues to improve.

Sales volumes remain much lower than a year ago, largely because institutional investors and iBuyers are missing in action on the buying front. A year ago they were competing frantically, which they probably now regret. However sales in March are up 32% from February and only down 25% from March 2022, which compares favorably with down 29% in February and down 39% in January.

iBuyers create 2 transactions instead of one, so transaction volumes will fall when they stop (or almost stop) buying. Demand from normal buyers weakened in March, mostly due to higher interest rates. But these interest rates are lower again in early April, and the drop in demand has been overwhelmed by the sharp drop in supply. Active listings without a contract fell by 5.5% during March whereas listings under contract fell only 1.9%.

The balance between supply and demand has been moving consistently in sellers’ favor since mid November. This confirms we are in the rebound phase of the correction that dominated the second half of last year and created an atmosphere of fear throughout the market. That fear can now be replaced with relief as one market signal after another turns positive and resumes a normal trend. Despite the doomscrollers on social media and elsewhere, today’s market is healthier than it was in April 2019, which at the time we were perfectly comfortable with. Casual observers tend to worry about factors which can cause weakness in demand, then forget to balance that with factors that can cause weakness in supply. Right now, supply is weakening much faster than demand, so interest rate movements are no longer the key thing driving the market. Competition between buyers is starting to warm up because there are so few sellers. This should not surprise us. Supply is just as important as demand.

The USA is unusual in having a very large percentage of its existing mortgage loans at fixed interest rates. In most countries, the majority of mortgage loans have adjustable rates. In Central Arizona this means loans written more than a year ago look very cheap compared with new loans. This deters homeowners from selling homes, unless they don’t need them. They may not need a home if they have just inherited it from a relative who died, or if it is a second home or investment. But if they have a primary residence, selling that home means killing a very cheap mortgage and giving birth to one with a more expensive new rate. Most people do not want to do that. In 2022 we saw a flood of supply from investors, speculators, panicking iBuyers and the like, but this wave has exhausted itself. We are back to a chronic shortage of homes to buy. We have less than 14,000 available, which is about 40% below normal. Demand is indeed weak, but it is only 18% below normal. Do the math.

Prices have moved higher even earlier than we expected. The monthly median is $419,900, up from $410,000 in late February. The average closed price per square foot has reached $277.60, up from $265,20 on Feb 9. That is almost a 5% rise in just 7 weeks.

The listing success rate is back to 78% or so, having fallen to a low of 62% in November last year.

Foreclosure activity remains minuscule. There is little sign of much new supply coming from that direction antime soon.

New construction permits for single-family homes are currently low, so there will be limited new supply from builders for a while.

It is time to re-adjust buyers to expect increasing competition from each other as they chase a dwindling number of homes for sale. Sellers have recently been offering generous incentives including substantial interest rate buy-downs. Those incentives are likely to reduce in value as sellers start to realize they have the upper hand in negotiations.

A few areas on the outer fringes of Greater Phoenix still have a robust supply. These include Buckeye, Casa Grande, Coolidge, Florence, Maricopa and San Tan Valley. However these are counter-balanced by extremely low numbers of active listings in the more affordable central areas, such as West Phoenix, South Phoenix, Tolleson, South Glendale and West Mesa.

Do not make the mistake of thinking the market is the same as it was in late 2022. We are in a new and very different phase.

​*****I have moved from neutral to now again a sellers market, interest rates have moved down about 1% from the high, if your holding off on buying because you think we have a substancial down-turn on its way, thats a mistake…..BUY now….

​*****If you’re considering selling or buying give me a call to discuss your situation and current market conditions.  If you’re on the sidelines waiting to buy because you think there will be more downturn or a crash in the market that’s a mistake, this is the time to buy……

I love referrals! Please remember me! Thank you, Shawn, your Realtor. 

Here Is The Outlook for The Arizona Economy: Click link below to read

Here is the outlook for the Arizona economy – AZ Big Media